

Planifica mejor tus rutas en México

Plan and optimize your routes in seconds.
tus rutas en segundos


Automate all your last-mile processes
You'll have all the parameters you need to give you the best results instantly.


Finally a simple planner that you can use today.
.webp)
The drivers they only need a cell phone and internet access.

Raise the customer experience.
Precise updates.


We help large and small companies in . Thank you!


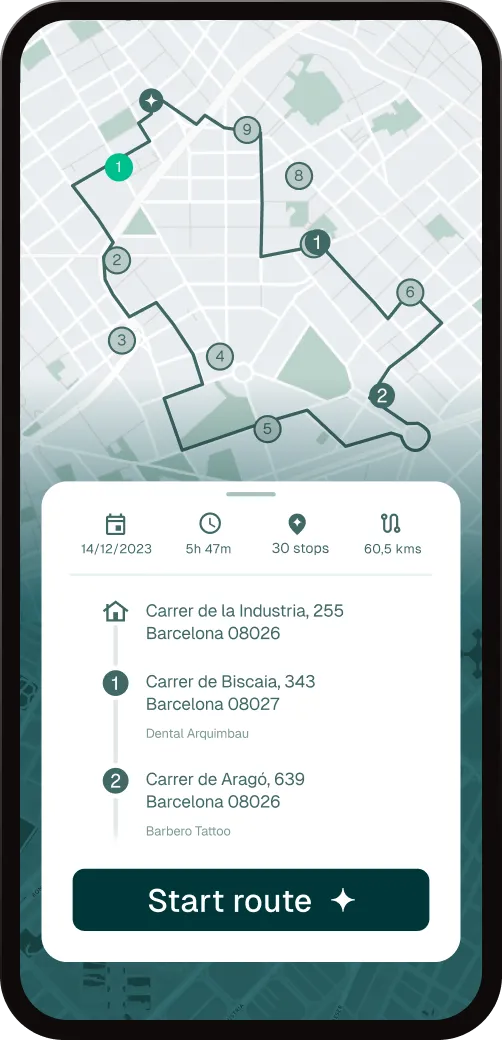
Optimize your routes in 3 clicks
Add your vehicles
Simplify the planning process by adding your delivery stops in a variety of ways.


Optimize your routes
Our advanced algorithms analyze data and generate the most effective routes in seconds.

Monitor your operations
You can optimize all the parameters you need. You'll gain time, money and precision.


Success stories, transformative results.


Routal has allowed us to save 21% in logistics costs, improve on-time deliveries to more than 96%, and have our customers more satisfied with the service on a daily basis.


During Covid, we realized that it was essential to standardize the delivery procedure. Thanks to the Routal planner, we were able to unify processes.


We chose Routal because they are integrated into our company's systems and encompass several processes in a single tool. From route planning to final delivery to the consumer.


Waste collection is a highly regulated sector. The traceability of waste is essential. Routal is an essential tool for our daily lives.


Routal has allowed us to save 21% in logistics costs, improve on-time deliveries to more than 96%, and have our customers more satisfied with the service on a daily basis.
Our latest news and industry know-how.
%20(39).webp)
Your customer placed the order on Monday. On Wednesday morning, you don't know if the package is in the warehouse, in the van, or on your neighbor's doorstep. Call your team. Your team calls the driver. The driver is on the road and cannot respond.
That moment — the moment of the call that shouldn't exist — is the problem that last-mile tracking solves.
What is last mile tracking
Last-mile tracking is the real-time visibility of an order's journey from the moment it leaves the warehouse or distribution center until it reaches the customer's hands.
It's not just knowing what van you're in. It means being able to answer, at any time, the most frequently asked question in e-commerce: Where is my order?
A last-mile tracking system connects three points:
- The manager, who needs to know that the operation is proceeding according to plan.
- The driver, who has the updated route on his mobile phone without the need for calls or WhatsApp messages.
- The end customer, who receives delivery information without having to ask for it.
When all three points are connected, the phone stops ringing.
Why last-mile tracking matters more than ever
Five years ago, a customer waited relatively patiently for their order. Today, after years of next-day deliveries with real-time location, the expectation has changed.
It's not a whim. This is the standard set by large logistics operators - and that your customers now expect from any company that delivers something to them, whatever fleet they have.
The data confirms this: more than 70% of consumers consider that the visibility of the shipment is as important as the speed of delivery. And a delivery without information generates 3 to 5 times more support contacts than a delivery with active tracking and a number of failed deliveries greater than 12%.
In operational terms: without tracking, your customer care team is managing uncertainty full time.
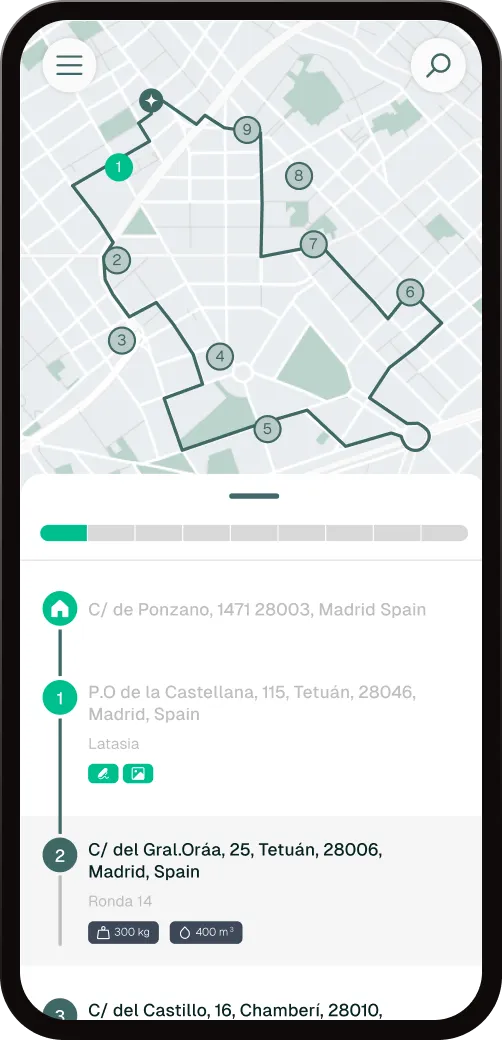
What information does a good tracking system provide
Not all follow-up is the same. The difference between a basic system and one that actually works is in what data it delivers and to whom.
For the manager
- Real-time position of each vehicle on the map.
- Status of each stop: pending, on track, completed, with an incident.
- Deviations from the planned route — and automatic alerts if something goes out of the way.
- Historical record of the route at the end of the day.
This is not control. It's having the same level of information as your end customer - without depending on the driver finding a time to call.
For the driver
A well-designed system doesn't add work. The driver follows his route in the app, marks the stops as completed and the system updates the status automatically. No forms, no intermediate calls, no friction.
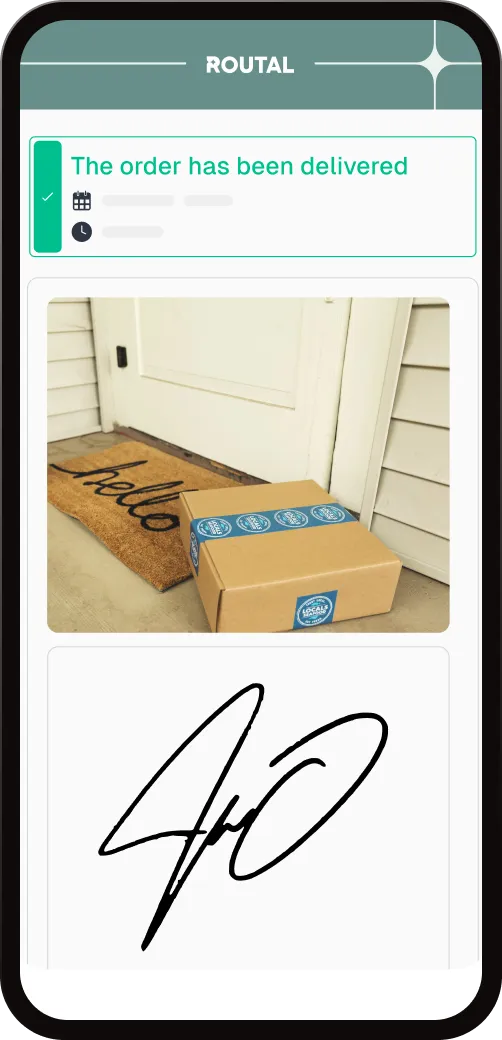
For the end customer
The most visible piece: a notification or a tracking link that the customer can consult at any time. You know what order your stop is in, how many deliveries are left before yours and when you can precisely wait for the driver.
That information transforms the waiting experience. From a black box to a transparent process.
What happens when there is no tracking
As usual: the customer calls the customer service number, who calls the manager, who calls the driver. If the driver is driving, the information is late, incomplete, or doesn't arrive.
Outcome:
- Team time spent locating packages instead of solving real problems
- Customers who perceive a lack of professionalism, regardless of whether the delivery arrived on time.
- Negative reviews about the delivery experience, not about the product.
- Second call if the problem was not resolved on the first call.
- Reattempts to log in, more cost, worse service.
All of this has a direct cost. And all that disappears when the customer has access to the information before picking up the phone.
Last-mile tracking and your operation
Implementing last-mile tracking doesn't require changing the entire fleet or hiring a technology team. The current systems work with the mobile phone that each driver already has.
What it does require is a platform that connects route planning with real-time visibility and customer notifications. Without that connection, you have data but no flow. You have technology but no peace of mind.
Routal Planner integrates the status of the fleet in real time with the planned route, automatic notifications to the customer and the record of each stop. All from the same platform with which you already manage your routes.
The customer knows where and when their package will arrive. Your team knows how the operation is going. And you can dedicate your day to what matters. Discover Routal Planner →
%20(38).webp)
It's 7 in the morning. Today's orders are now on screen. You have 12 drivers waiting, 180 stops to distribute and the same feeling as always: this is going to take two hours.
First you organize by zones. Then you try to make the delivery times add up. Then check that no van is overloaded. And when you finally think it's ready, an urgent order arrives that takes everything apart.
That process—which you do with a map in your head, an Excel and plenty of coffee—is exactly what an Intelligent Planner solves in less than a minute.
What exactly does an Intelligent Planner do
It's not magic. It's not science fiction. It is a system that simultaneously analyzes all the variables that you are trying to balance by hand: distance, driving time, delivery time windows, capacity of each vehicle, access restrictions, traffic in real time.
It does it in seconds. And he does it without fatigue, without making mistakes and without affecting him if the previous day was especially hard.
The result isn't just a shorter route. It's a route that takes into account everything that matters so that each delivery arrives on time and your team gets home at a reasonable time.
What changes in your day-to-day operation
Planning ceases to be the bottleneck
In operations with manual planning, the process can take between one and three hours each morning. That time has a direct cost—that of the manager who dedicates it— but also an invisible one: the manager who arrives at 9 already exhausted, before the real day begins.
With an Intelligent Planner, that same process is done in five to fifteen minutes. Not because you simplified the problem, but because the system solves it faster and better than any human could do it manually.
That recovered time doesn't go away. It becomes attention to unforeseen events, calls to customers, the ability to grow without hiring more people.
Your team has routes that make sense
A poorly planned route doesn't just use more fuel. It frustrates the driver who sees poorly ordered stops, who retraces his steps, who is late for a time window because the previous one was too far away.
When the routes are well calculated, the team follows them. And when you follow them, the results are predictable: fewer delays, fewer customer calls, fewer last-minute adjustments.
The difference between a good route and an optimal route is invisible to the customer. For the driver, it's the difference between a smooth day and one where everything seems to be going uphill.
Unforeseen events are managed, not improvised
In any operation there are unforeseen events: a driver leaving, an accident that cuts off a road, a customer who asks to change the delivery time at the last minute. The question isn't if they're going to happen, but what you do when they happen.
With manual planning, an unexpected event can force you to redo everything by hand in the middle of the day. With an Intelligent Planner, you can recalculate affected routes in seconds, reassign stops and alert drivers without the rest of the operation stopping.
This capacity to response—to absorb chaos without being noticed—is one of the most difficult and most appreciated changes to quantify.
Your customers know when their order arrives
One of the least visible effects of intelligent optimization is what happens at the other end of the chain: the person waiting for the order.
When the route is well calculated, the estimated delivery times are reliable. And when the times are reliable, the system can automatically alert the customer with a realistic delivery window — without anyone having to do anything.
The result is fewer “where's my order?” calls , fewer failed deliveries because the customer wasn't at home and more trust in the service. That last point is what makes customers repeat.
What doesn't change
An Intelligent Planner does not replace the manager. There is still a need for someone who knows the operation, who makes decisions when there are real exceptions and who maintains a relationship with drivers and customers.
What changes is what that manager invests his time in. Less about squaring a logistical puzzle that an algorithm could solve. More on what only one person can do: adapt, relate, anticipate.
Where to start
If your operation is still planning routes by hand —or with Excel, or with Google Maps in a loop—, the first step is not choosing a tool. It's measuring how much the current process is costing you.
How much time does someone spend each morning planning? How many kilometers do your drivers travel that could be avoided? How many failed deliveries per month result in a second visit, a call or a complaint?
With those numbers on the table, the conversation changes. If you want to see how they fit into the context of your company, you can calculate the potential impact in this ROI guide or review the metrics that most affect your last mile operation.
And if you want to see how the Routal Smart Planner works with your own routes, you can test it without installations or contracts. Create your first route →
%20(37).webp)
When someone on the team proposes to invest in route optimization software, the director's first question is always the same: And how much is this going to save me?
It's the right question. But the problem is that most companies only count part of the savings - fuel - and leave out the seven or eight concepts where real money is escaping every day without anyone seeing it on any bill.
This article gives you a method for calculating the full ROI of a logistics optimization project. Not with generic promises, but with specific variables that you can fill in with your company numbers.
Why the ROI of logistics is always underestimated
When it comes to logistics efficiency, the instinct is to look at the direct and visible costs: kilometers, liters of diesel, driving hours.
But an inefficient operation generates losses in layers that are harder to see:
- The manager who arrives at 6 in the morning to plan routes by hand and finishes at 9
- The customer who called three times this week and the fourth will no longer call — they will buy somewhere else
- The customer service worker who spends half a day answering “where is my order?”
- The day the holiday traffic chief left the operation in the hands of someone who didn't know how the routes worked
These costs do not appear on any line in the income statement. But they do exist. And they add up.
The 8 savings levers — with real examples
1. Reduction of kilometers, fuel and maintenance
It's the most tangible savings and the easiest to calculate. A route optimization engine reorganizes the order of stops to minimize the total distance traveled. In operations that are planned manually, the deviation from the optimal route is usually between 20% and 35%.
The calculation:
Imagine a company with 10 vans that travel an average of 150 km/day each:
- Current kilometers per year: 10 × 150 × 250 days = 375,000 km/year
- With a 30% reduction: 262,500 km/year — savings of 112,500 km
- At an estimated cost of 0.35 €/km (fuel + maintenance + amortization): 39,375€ annual savings
And this is not to mention that fewer kilometers are also fewer revisions, fewer tires and less time in the workshop, or even savings for an entire vehicle.
2. Planning productivity: 3 hours to 15 minutes
If your team plans the routes by hand, calculate how much time they spend doing so each morning. In companies with 5—15 vehicles, it is common for a manager to spend between 1.5 and 3 hours a day on this task: downloading orders, assigning them by zones, sorting them, printing sheets or sending WhatsApps.
With optimization software, that same planning is done in 5—15 minutes.
The calculation:
- Current planning time: 2 hours/day × 250 days = 500 hours/year
- Optimized time: 15 min/day × 250 days = 62.5 hours/year
- Savings: 437.5 hours/year — 87% less
- If the manager's hourly cost is 20 €/h: 8,750€ in annual savings
But the real number isn't just the cost of those hours. That's what that manager can do with that time: deal with incidents, improve relationships with customers, or not start the day already exhausted.
3. Real-time information: fewer calls, better decisions
Without real-time visibility, managing a fleet is like playing chess with your eyes closed. When you don't know where each driver is or how the route is going, you manage with calls. Lots of calls.
With continuous monitoring:
- The manager sees on the map if a route is being delayed and can act before the customer calls
- Stops can be reassigned in real time if a driver has an unforeseen event
- The customer automatically receives the updated ETA, without anyone having to call them
The invisible impact: each such interruption breaks the focus for at least 10—15 minutes. In a day with 15—20 follow-up calls, the manager loses between 2 and 4 hours of productive work.
4. Standardized processes: the basis for growth without chaos
A well-documented and systematized operation can be replicated. When the planning process lives in a person's head or in an Excel full of formulas that only they understand, scaling is impossible.
With standardized processes:
- Incorporating a new zone or a new driver is following the same flow, not improvising
- Opening a new warehouse or route does not require months of adaptation
- Performance is predictable, not dependent on who is there that day
This is the value that managers most underestimate until they want to grow and realize that their operation cannot scale without hiring more managers.
5. Reducing operational risk: what happens when “the one who knows” isn't there?
This is the most invisible cost of all, and also the most dangerous.
Almost all logistics companies have a “Manolo”: the person who has been doing the same routes for 12 years and who knows by heart which customer wants delivery before 10 o'clock, which street is not accessible with a large van and how to balance Tuesday's routes when there are two drivers leaving.
When Manolo goes on vacation, the following week is a disaster. And when Manolo retires or leaves the competition, the company loses an asset that is priceless — because he never documented it.
How to quantify it:
- How many hours of training and adaptation does a new manager require? If it's 3 months, you're talking about 480 hours of lost productivity
- How many failed deliveries or delays does a week without the expert manager generate? If the incident rate rises by 15%, that has a direct and indirect cost
- How many customers leave during this period of instability?
Systematizing knowledge isn't just efficiency — it's business insurance.
6. Better customer experience: the satisfied customer repeats and spends more
The impact of well-managed delivery doesn't end when the package arrives at the door. A customer who receives their order on time, with prior notice and without having to call anyone, is a returning customer.
And one who doesn't come back is a customer who found someone who does it better.
The calculation of the impact on revenues:
- If you have 500 active customers with an average annual ticket of 1,200€
- And an improvement in the delivery experience retains 5% of customers who are currently lost to incidents: 30 customers × 1,200€ = 36,000€ of retained revenue
- If these customers also increase their average ticket by 10% because they trust the service more: 500 × 120€ = 60,000 additional €
The quality of delivery is today the most difficult differentiator to copy in last-mile logistics. Not speed, not price — reliability.
7. Fewer manual tasks: How many people are there on your customer support team?
The “where's my order?” calls they are not just a nuisance. They are a personnel cost that can be measured precisely.
If your customer service team spends 40% of its time resolving delivery issues that could have been prevented — late calls, unlocated orders, delivery confirmations — you're paying salaries to manage operational inefficiencies.
The calculation:
- 2 customer service people at 25,000 €/year = 50,000 €/year
- 40% of the time in avoidable delivery efforts = 20,000 €/year in avoidable cost
- With automatic ETA notifications, digital delivery confirmation and public tracking for the customer, that percentage can drop to 10— 15%
- Potential savings: 12,500—15,000 €/year — without reducing the quality of service
8. Proactive distribution: Anticipate errors before they cost
A logistics error has two prices: the direct cost (the second delivery, the call, the discount to the customer) and the cost of the relationship (the trust that erodes, the negative review, the customer that does not renew).
Monitoring tools allow you to identify deviations in real time and take action before they become formal incidents. If a driver is 20 minutes late at the first stop, the manager can alert the next customer or reassign a delivery — instead of knowing when the customer is already angry.
The impact:
- If currently 8% of your deliveries cause some type of incident (delay, failure, complaint) and you can reduce it to 4%: out of 5,000 monthly deliveries, that's 200 fewer incidents per month
- If each incident costs between 15 and 30€ in time, redelivery and administrative management: 3,000—6,000 € monthly savings
9. Lower environmental impact: the door to contracts you couldn't win before
This point rarely appears in traditional ROI calculations. But in 2026, it has a direct impact on the revenues of many companies.
More and more medium-sized and large companies are demanding CO₂ emission data from their logistics operators as part of the tender process. If you can't measure and report your carbon footprint, you're directly left out of that conversation.
Optimizing routes reduces mileage — and with it, emissions. Routal automatically calculates the CO₂ emissions avoided on each route.
The strategic impact:
- Access to corporate clients with ESG (Environmental, Social, Governance) requirements
- Differentiation from competitors who cannot measure or report their footprint
- Positioning in the face of ZBE (Low Emission Zones) regulations that already affect many cities
The ROI calculation: a complete example
Let's take a real company with these parameters:
Variable Value Number of vehicles 10 km drived/day per vehicle 150 km Operating days per year 250 Cost per km (fuel + maintenance) 0.35 €/kmCurrent planning time 2 hours/day Manager's hourly cost 20 €/h People in customer service2 (25,000 €/year each) Monthly deliveries 5,000 Current incident rate 8%
Estimated annual savings:
ConceptEstimated SavingsReduction of kilometers and fuel (30%) 39,375 €Planning productivity (-87%) 8,750 €Reduction in customer service management15,000 €Reduction of incidents and redeliveryes36,000—72,000 €Retention and growth of customers36,000—60,000 €Estimated total 135,000—195,000 €/year
Software costs:
For a fleet of 10 vehicles, Routal is around 5,000—8,000 €/year.
First-year ROI: between 1,600% and 2,300%
Or to put it another way: the software pays for itself in the first 2—4 weeks of operation.
Invisible costs hurt the most
When someone says “I can't justify this investment”, it's almost always because they're just counting fuel. And that's like valuing a company only by its cash flow.
The real costs of an inefficient logistics operation are:
- Manager's time That I could be doing other things
- Repeated errors because no one has systematized them
- Customers who are leaving because the delivery was not what they expected
- Knowledge that goes away When does the person who had it leave
- Contracts that don't fit Because you can't prove your carbon footprint
None of these appear on the diesel bill. But they all appear, in one way or another, in the income statement.
Where to start
Before evaluating any tool, do this exercise:
- Calculate your real planning cost: minutes per day × days per year × manager's hourly cost
- Estimate your incidence rate: How many deliveries per month do a call, a redelivery or a claim generate? How much does each one cost?
- Ask customer support: What percentage of your interactions are about logistics? How much time do they spend?
With those three numbers on the table, the conversation about ROI changes completely.
If you want to do that calculation with your company data, at Routal we help you build it before you make any decisions. Talk to us
Move the world smarter


.png)
